 |
version 3.11-dev
|
|
version 3.11-dev
|
Problem Description
A straight channel of length \(L\) and width \(W\) has a bed that descends along the channel with the slope \(S\). Water enters the channel with the discharge \(q\) per unit width. The bed shear stress follows the law of Gauckler, Manning and Strickler (Dumux::FrictionLawManning),
\begin{align}\frac{\tau_b}{\rho} = \frac{g n^2}{h^{1/3}} \, u |u|, \end{align}
where \(\rho\) is the density of water, \(g\) the gravitational acceleration, \(n\) Manning's coefficient, \(h\) the water depth and \(u\) the depth-averaged velocity along the channel. The side walls are impermeable and free of friction.
Exact Solution
In normal flow, depth and velocity are uniform and the bed friction balances gravity, \(g h S = \tau_b/\rho\). With \(u = q/h\), the normal depth and the normal velocity are
\begin{align}h_n = \left( \frac{n q}{\sqrt{S}} \right)^{3/5}, \qquad u_n = \frac{q}{h_n}. \end{align}
For the parameters below, \(h_n = 0.8685\) m and \(u_n = 1.1514\) m/s.
Parameters
| Parameter | Symbol | Value | Unit |
|---|---|---|---|
| Channel length | \(L\) | \(500\) | m |
| Channel width | \(W\) | \(5\) | m |
| Bed slope | \(S\) | \(10^{-3}\) | - |
| Manning's coefficient | \(n\) | \(0.025\) | s/m1/3 |
| Discharge per unit width | \(q\) | \(1\) | m2/s |
| Gravitational acceleration | \(g\) | \(9.81\) | m/s2 |
Setup
The shallow water model is discretized with cell-centered finite volumes (Two-point flux approximation (Tpfa)) and the implicit Euler method. The flux over a face is the flux of the exact solution of the Riemann problem with hydrostatic reconstruction of the bed [12], and the bed friction enters the momentum balance as a source term. The bed elevation is constant in each cell. The discharge \(q\) is prescribed at the inflow and the normal depth \(h_n\) at the outflow. Since the outside state at the boundary face has the bed of the inside cell, the prescribed depth is shifted by the bed difference between face and cell center, such that the free surface elevation at the face is matched.
The grid of params.input has 500 cells along and 5 cells across the channel. The simulation starts from the normal flow and runs up to \(t = 900\) s with time steps of up to 60 s. On this grid, the \(L^2\) error of the depth at \(t = 900\) s differs from that of the steady state by \(3 \cdot 10^{-4}\) of its value. The test test_shallowwater_roughchannel compares the solution with a reference solution. The example shallowwaterfriction explains the implementation of this setup, there starting from a depth of 1 m and water at rest.
Results
The figure and the tables are produced by running
in the build directory test/freeflow/shallowwater/roughchannel (requires NumPy and Matplotlib). The grid is refined along the channel.
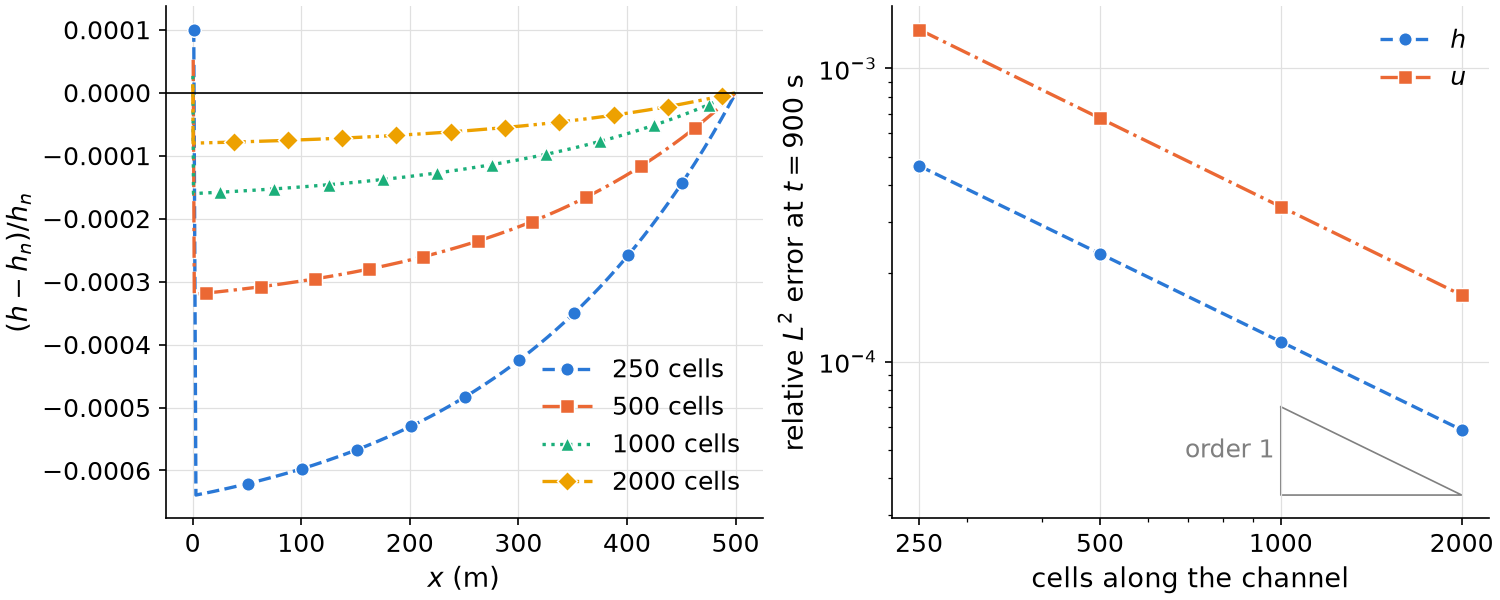
The table lists the relative discrete \(L^2\) errors at \(t = 900\) s, \(\| e \|_2 / \| h_n \|_2\) for the depth and \(\| e \|_2 / \| u_n \|_2\) for the velocity, with \(\| e \|_2 = \left( \sum_i |V_i| \, e_i^2 \right)^{1/2}\), where \(e_i\) is the difference to the normal flow at the center of the cell \(V_i\) with area \(|V_i|\).
| cells along the channel | rel. \(L^2\) error \(h\) | rate | rel. \(L^2\) error \(u\) | rate |
|---|---|---|---|---|
| 250 | 4.650e-04 | - | 1.356e-03 | - |
| 500 | 2.333e-04 | 1.00 | 6.756e-04 | 1.00 |
| 1000 | 1.168e-04 | 1.00 | 3.372e-04 | 1.00 |
| 2000 | 5.847e-05 | 1.00 | 1.685e-04 | 1.00 |
Depth and velocity converge with approximately first order. Toward the outflow, the depth approaches the prescribed normal depth; in the cell next to the outflow, it deviates by \(4.2 \cdot 10^{-6} h_n\) on 250 cells and by \(6.6 \cdot 10^{-8} h_n\) on 2000 cells. Upstream, except in the cell at the inflow, the depth is below \(h_n\), by at most \(6.39 \cdot 10^{-4} h_n\) on 250 cells and \(8.02 \cdot 10^{-5} h_n\) on 2000 cells.
The error stems from the bed, which is constant in each cell. In the steady state, the mass flux over each face equals the prescribed discharge \(q\). The hydrostatic reconstruction compares the depths \(h\) and \(h - S \Delta x\) at a face, where \(\Delta x\) is the cell size, and for these states the mass flux of the exact Riemann solver exceeds \(h u\) by \((c - u) S \Delta x / 2\), to first order in \(S \Delta x\), with the celerity \(c = \sqrt{g h_n}\). The discharge \(h u\) in the cells is therefore smaller than \(q\) by this amount. The script compares both in the cells between \(x = 20\) m and \(x = 120\) m:
| cells along the channel | \(h u - q\) (m2/s) | \(-(c - u_n) S \Delta x / 2\) (m2/s) |
|---|---|---|
| 250 | -1.7650e-03 | -1.7675e-03 |
| 500 | -8.8313e-04 | -8.8373e-04 |
| 1000 | -4.4172e-04 | -4.4186e-04 |
| 2000 | -2.2090e-04 | -2.2093e-04 |
The test test_shallowwater_roughchannel_convergence runs the grids with 250, 500 and 1000 cells and checks that the mean convergence rates of the relative \(L^2\) errors of depth and velocity are at least 0.95.
3.11-dev
Generated by  1.16.1